

Unexpected exceptions can be another interesting source of problems that may not only affect the performance of your application but also its functionality.
.NET Runtime Analyzer highlights all exceptions which occur during the application execution. For each exception, it shows thread stacks on a line-level base to indicate the source line from which the problem was raised.
Furthermore, the built-in exception profiler allows the analysis of specific exception types or exception creation stacks to display frequencies and their distribution within the timeline.
Sluggish application startup performance can be induced by poor software algorithms. We need to identify the root cause of these issues and fix the software.
Besides, we need to also provide the best infrastructure for our software to run. The key task then is to provide proper software deployment.
Before .NET software can run on the CPU, .NET assemblies must be translated from IL to native code. So we should deploy native images for assemblies which cause high time losses in order to minimize annoying runtime overheads.

Context information is key to investigate complex runtime issues. The more context information available, the more drilldowns are possible.
Some runtime issues just occur within certain time frames. The timelines of our performance diagnostics tools provide you with new analysis power to investigate issues within specific time ranges.
You can select time ranges to perform a partial analysis on the snapshot (profile and trace data will focus on the time range selection).
In addition, you can use trace statements and app events to identify interesting business aspects within the software.
For instance: Exceptions, File I/O events, Network events, Database-queries, HTTP-Requests, WCF-calls.

The profiler allows you to optionally include native stack frames for event trigger stacks. That way you can get known to issues which are triggered by native code such as win32 allocations from 3rd party libraries like the .NET runtime.

Enterprise applications are usually distributed accross multiple processes. In order to investigate runtime issues such as performance problems, communication failures etc. you need to be able to profile or trace multiple processes concurrently.
Besides, you are able to keep monitoring restarted processes such as recycled IIS application pools running ASP.NET services.
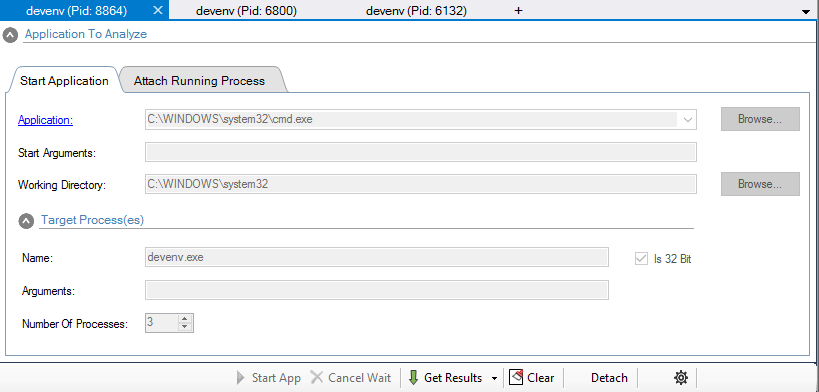
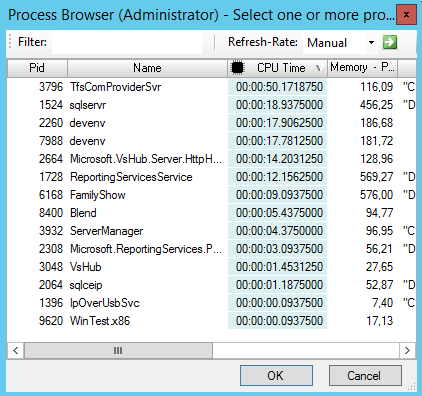
The profiler allows you to attach processes that are already running. It is even possible to attach to multiple processes simultaneously.
Due to the low profiling overheads, its fast event tracing and timeline capabilties, .NET Runtime Analyzer is the ideal tool to investigate runtime issues in production environments.
Input your search keywords and press Enter.