.NET Profiler Bundle is an easy-to-use set of tools to investigate various kinds of runtime issues of .NET applications
Download
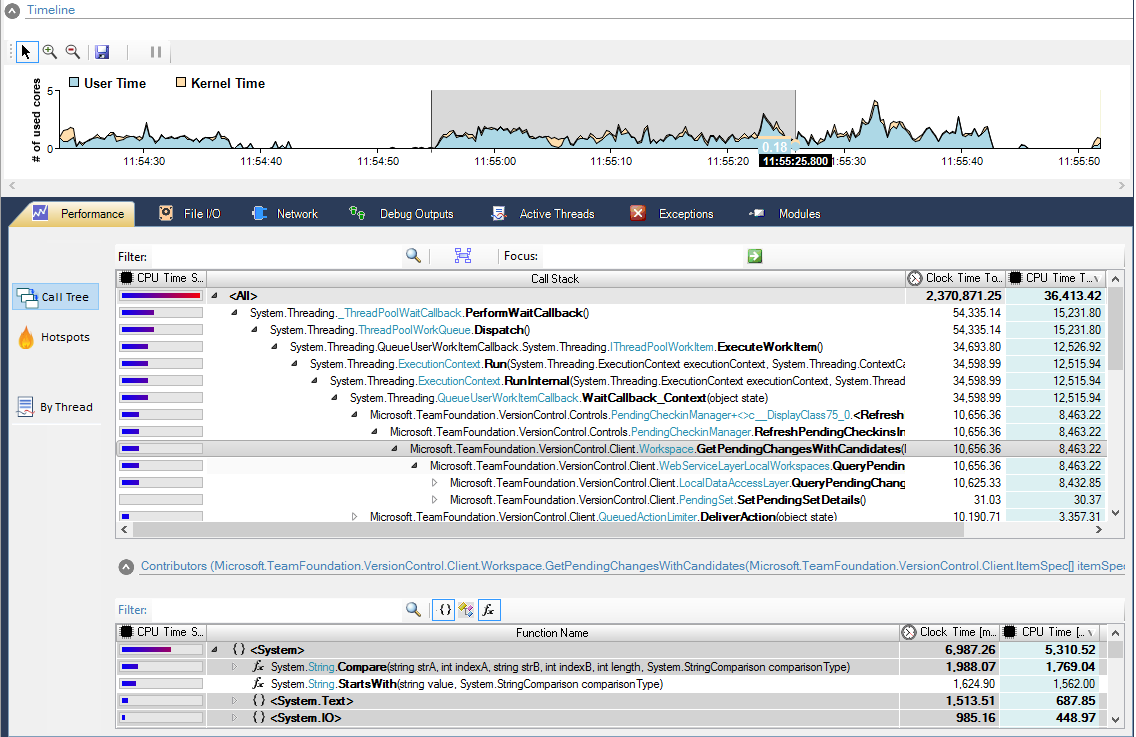
Performance Profiler
Fastest instrumentation performance profiler with highest accuracy
Line level sampling performance profiler to pinpoint performance bottlenecks within the application
Fast performance profiling with both CPU and clock time consumption information
Focus feature to minimize time to find root cause of issues
Timeline support to investigate performance issues over time
Network- & I/O-Traffic Tracer with Data Capture
Managed/unmanaged code profiling to analyze pure .NET or mixed applications
Minimized snapshot file size to allow long term storage
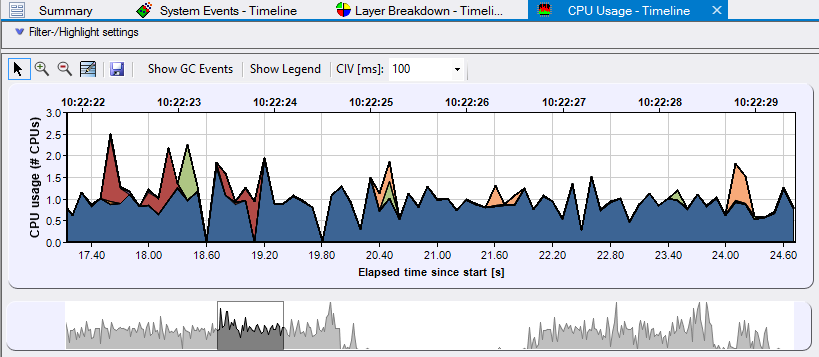
Timeline Analysis
The integrated .NET profiler SpeedTrace Pro empowers you to:
Analyze time ranges with slow response times or high CPU time usage
Investigate worst case execution times and its timely distribution
Analyze performance and quality issues of single transactions
Get known to transaction time percentiles to find out how often your performance requirements are violated
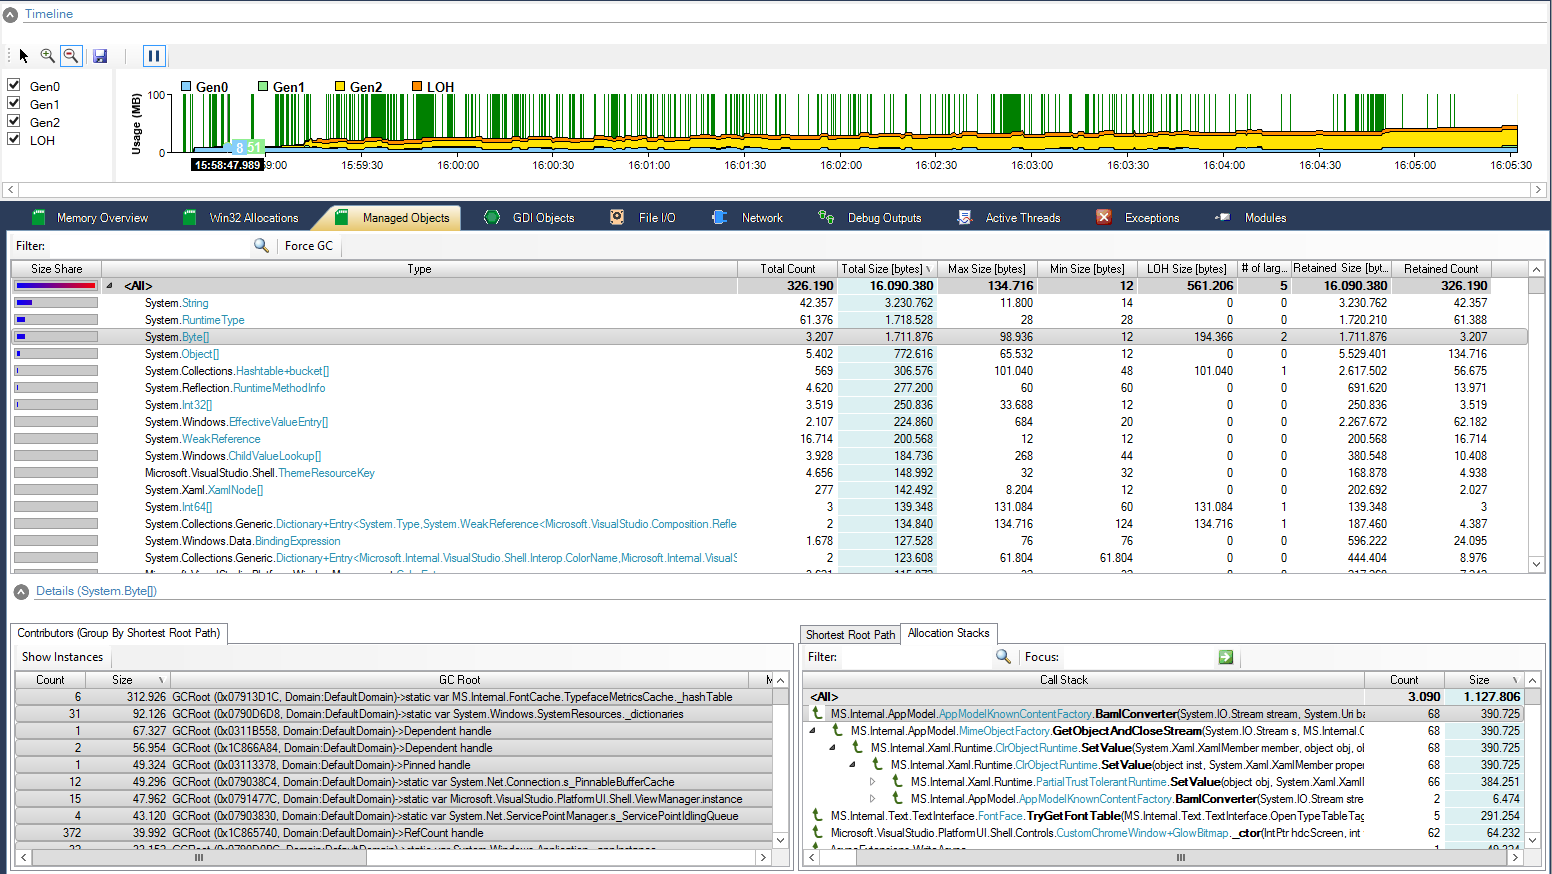
Memory Profiler & Resource Tracker
The included .NET Memory Profiler (powered by .NET Runtime Analyzer):
Provides memory overview to display usage by type (Managed Heap, Win32 Heap, Modules, Mapped Files, Stack etc.)
Displays Managed Memory usage with GC root paths and allocation stacks
Tracks Win32 memory allocations to pinpoint native memory leaks
Provides GDI resource tracking functionality
Support to import memory dump files
System & Application Event Tracker
The built-in .NET Application Event Profiler (powered by .NET Runtime Analyzer):
Selectively traces interesting system and application event topics with line level trigger stacks and event time stamp information
Tracks managed/unmanaged event activity with data capture, and error information
File I/O activity including named pipes: .NET Remoting / WCF calls, performed read/write operations including the data read/written
Network activity tracer: WCF calls, Database queries, Web Access with source and target endpoints
Startup-Performance optimizer to analyze JIT compilations, relocations
Concurrency analyzer (Threading Events with trigger stacks, Locks) to pinpoint threading usage
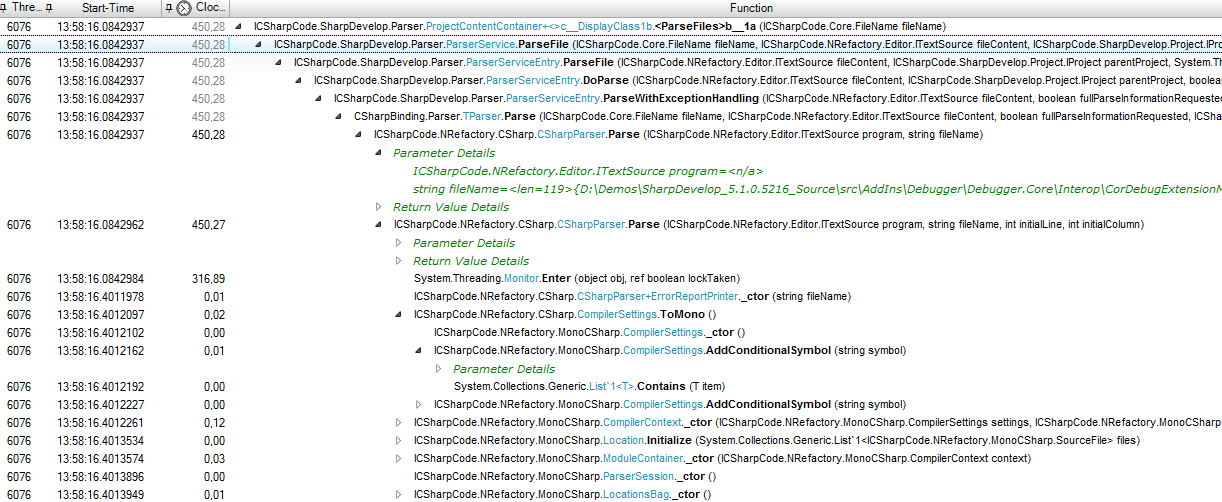
App Tracer For Bug Trapping
Often software issues occur at surprising places where no debug or trace info is available. With the integrated .NET Trace Profiler SpeedTrace Pro achieve the following benefits:
Minimize your own app logs to a minimum.
Get application insights right from your .NET app. SpeedTrace reveals the sequence of executed operations and recorded events. And the best - without manually added trace/debug statements.
Locate and fix software bugs using the traced app flow. Use also your logged data for the analysis if you want.
Analyze runtime issues like app freezes where the order of app events is important.