.NET Profiler: Debug, Analyze & Fix Performance Issues
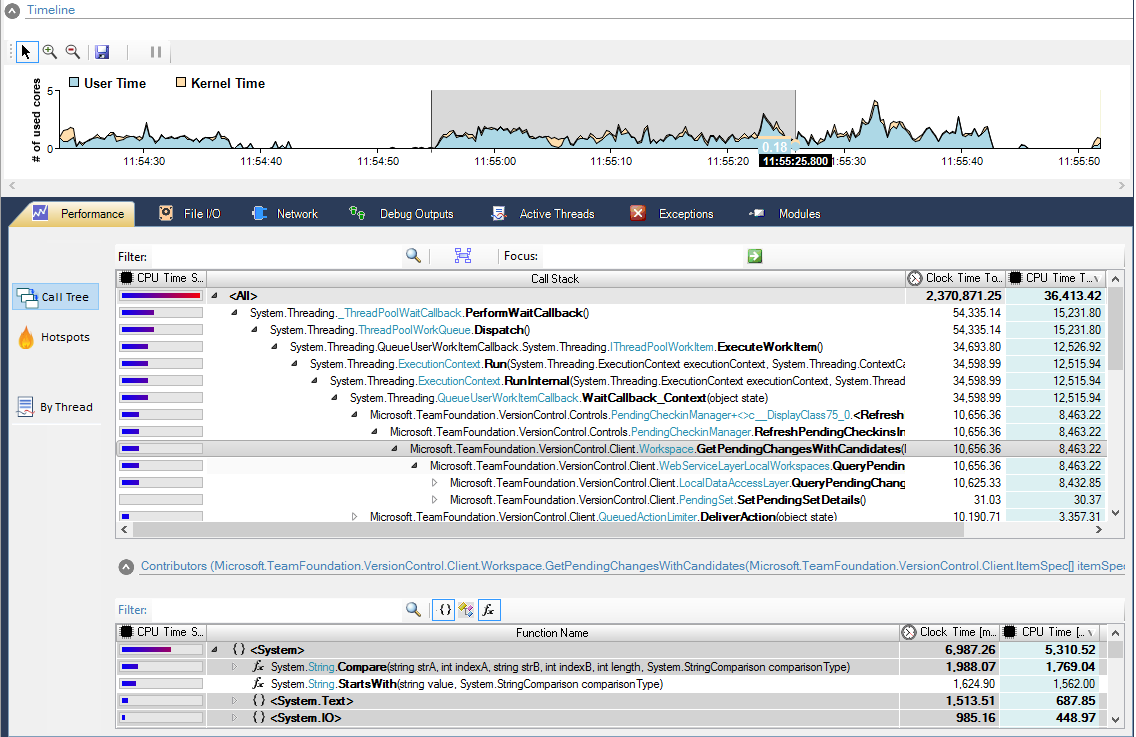
The powerful line level sampling profiler provides functionality to pinpoint performance bottlenecks within the app. In contrast to a classic .NET profiler, our software allows the user to analyze processes with native code. Thus, performance issues triggered by native code can be identified, for instance from 3rd party libraries like the .NET runtime.
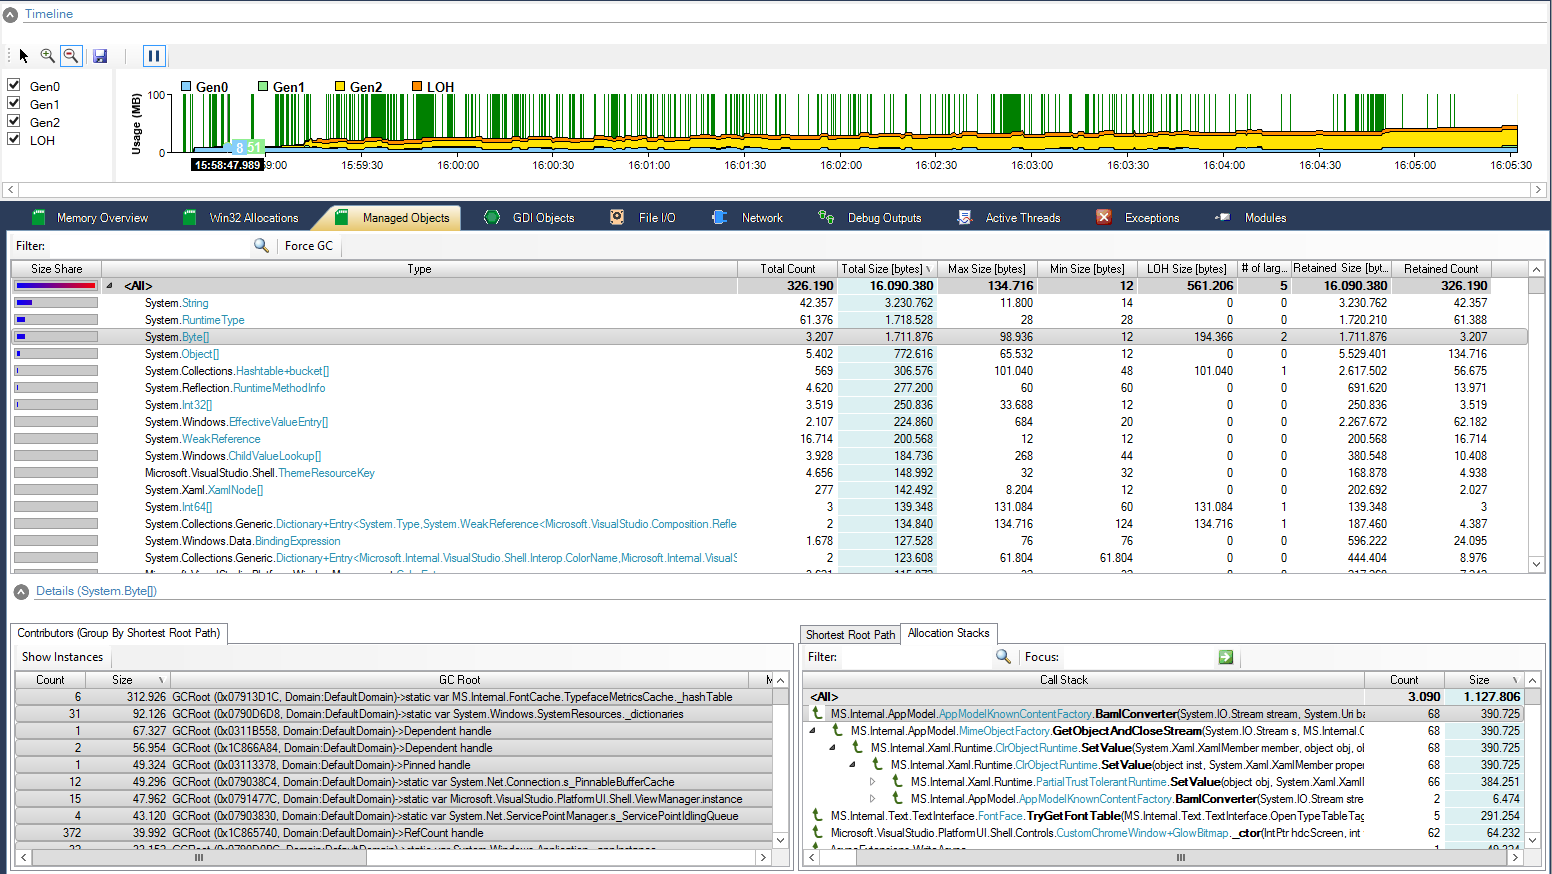
In addition, the tool supports event tracing to maximize the user experience. File I/O activity, network activity and debug events can be captured. That way interesting app insights can be correlated with the timeline. Data context information can be added to investigate internals of apps beyond code level.
The built-in timeline functionality empowers the user to process interesting time ranges.