Data context integration

SpeedTrace Pro allows you to enrich application logs with data context to analyze data dependent performance or runtime issues.

The data capture can also be used to monitor HTTP requests and responses or SQL queries. In case of access of local databases the information can be captured via File I/O.

Simplify Complexity

Maximize the efficiency of performance investigations by minimizing the complexity of the analysis.

Significantly reduce your analysis time by removing irrelevant information using rich filter functionality to stay focused!

Test Automation API

SpeedTrace Pro provides a special test automation interface though which you can set up your own testing environment to trace and profile across networks and throughout the Internet.

Testing with the SpeeedTrace Pro Test Automation environment is performed systematically in “zipper”-fashion parallel to the development process and repeated over and again, unit by unit, at short intervals. Test automation thus becomes an integral part of the of the development process and lends itself appreciably to optimizing lifecycle management and proactively internalizing QA into the entire development cycle.

Local & Remote Tracing

SpeedTrace Pro now offers comprehensive remote tracing capabilities, perfectly suited for distributed applications. With this advanced feature, you gain direct remote access to all client trace scenarios directly from the server end, all through the convenience of the cloud!

Custom Data Provider

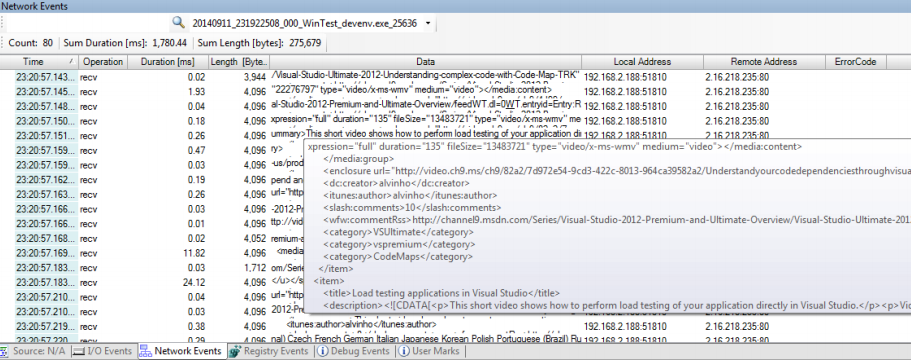
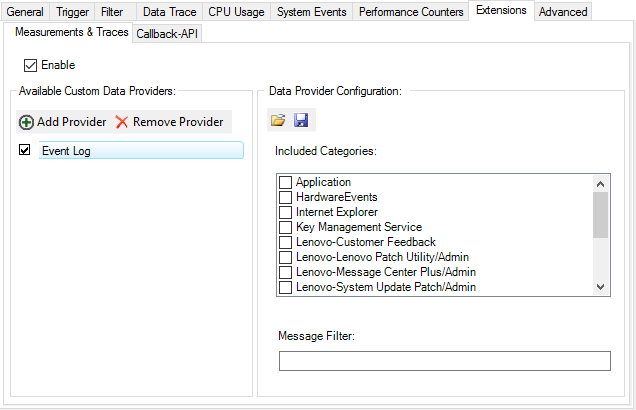
With SpeedTrace Pro you can add custom data providers, so that interesting application context information is captured and presented in the UserMarks views, the timeline graphics and data view. The data provider extension allows out of target process tracing and is fully integrated with the trace project configuration management.

Compare & Merge Trace Sessions

SpeedTrace Pro provides functionality to compare and merge trace files:

  • Comparisions are useful for regression testing. After performing optimizations, do we now meet or still miss our performance requirements? Do we still run into runtime exceptions after applying bug fixes? Another use case is to compare nightly builds to find out if newly introduced functionality or stability fixes negatively impact the overall performance.
  • SpeedTrace Pro provides merging functionality to simplify the analysis process when analyzing multiple traces, for instance in case of load balanced applications, multiple processes on multiple machines can be analyzed in one analysis session. In case of enterprise applications, context information from one process can be used to analyze the other process. Also, communication latency times could be evaluated to find out, how long it tooks until the requests and responses get actually received and processed by the communication partner.

Performance Forecasts

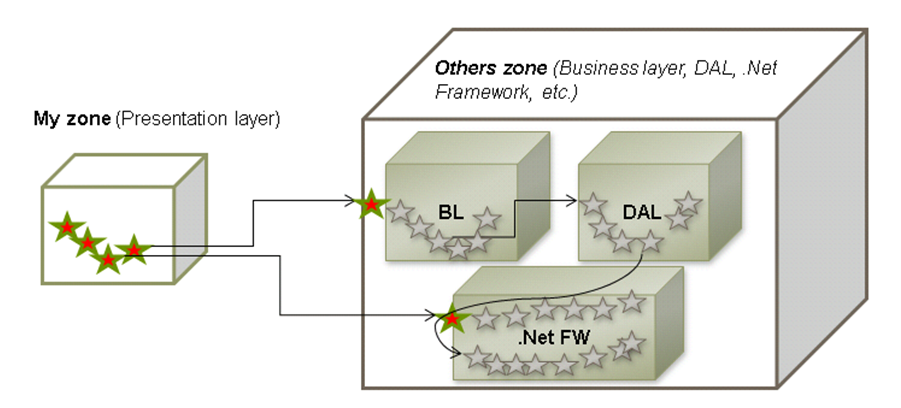
Before applying actual code changes the SpeedTrace user can perform simulations to find out how the planned modifications would affect the overall performance. Simply specify the speed up factor for each optimized method, so that the performance data can be recalculated. As a result of the “what-if”-simulation the benefits of the planned optimizations will be presented in all profile views.