SpeedTrace Pro is a most powerful tool – much more than a profiler, it helps you to investigate complicated issues and to find their root causes with advanced functionality.
SpeedTrace Pro is not just a one night affair. It is really worth getting involved in a long-lasting relationship with all its responsibilities and refreshing surprises. To show this we have created a more elaborate web scenario (below) to demonstrate how SpeedTrace masters the complexities of web-based applications with great ease and elegance.
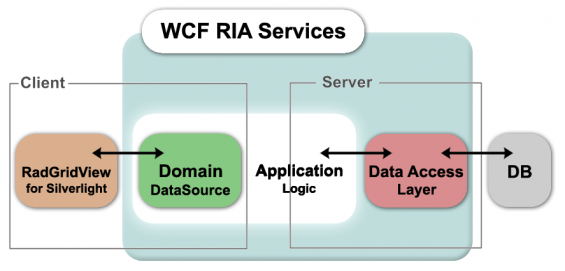
We are going to examine the client server communication in a WCF RIA Services scenario where the web server is IIS 7 running ASP.Net 4 and the client is Firefox running Silverlight 4.
Trace project setup
In order to analyze the communication between client and server, we need to trace the Silverlight client and the IIS server at the same time. So let’s first create the necessary trace project: We will choose a slightly modified version of an IIS project because we want to trace both the IIS server and the Firefox plugin container. Since we want to perform local tracing, we simply keep the local host as target computer (#1). After having specified the target website (#2) which is going to be traced we add the Firefox plugin container to the w3wp (#3) worker process as another application to be traced and inform SpeedTrace to trace exactly two processes (#4). If we have multiple w3wps running, we can filter the application pool or also trace multiple instances. Finally, we uncheck start recording immediately, because we do not want to trace the application startup.
Trace project activation
After having activated the trace project, the default browser will open the specified website, so that the IIS webserver and the Silverlight application get activated and the SpeedTrace trace agent will attach to the processes.
The trace session manager will display information about the active trace sessions (CPU usage, target process name, target computer, trace state etc.) and can also be used to control the trace state.
Trace scenario
The Silverlight client displays data from the Northwind Database which is hosted by the MS SQL Server:
Our trace scenario is to perform paging within the data grid. Whenever we reach the last page, we re-assort the data and page again until we have executed 32 paging operations. Tracing will be started shortly before the first and stopped after the last paging operation.
Trace Results
As soon as we stop the trace, we will receive the trace output files for the affected trace sessions. In our case, one trace file for the IIS server, and one for the Silverlight client.
Trace Analysis
Now, here comes the interesting part – the trace analysis. Using SpeedTrace it is easy to find the reason for performance bottlenecks, but what about analyzing communication times between two processes?
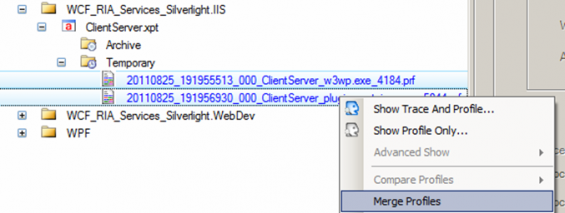
Let’s first merge the two trace files into one analysis session:
Get the Big Picture – Layer Breakdown over time
The layer breakdown, the bird’s eye view, would look like this for the Silverlight client
(showing high presentation layer consumption):
And like this for the IIS server (showing high DAL consumption):
CPU usage – Timeline
Finally, before we get started with the actual analysis, let’s have a quick look at the CPU time usage of both processes.
For the IIS server:
For the Silverlight client:
Communication Analysis
Let’s first talk about the involved APIs:
Having analyzed the client and server trace, you will see that …
… the Silverlight client …
1) … starts service requests via ServiceChannelProxy.InvokeBeginService()
2) … receives the response via HttpChannelFactory.OnGetResponse()
3) … and ends it via ServiceChannelProxy.InvokeEndService()
… the IIS server will receive and dispatch the request within ChannelHandler.HandleRequest().
So let’s have a look at the timeline regarding the mentioned APIs: We do this by using Call History …

When you look at the times, you will notice that
#1 The request is sent to the server in just 3 ms …
#2 After a server processing time of about 22 ms …
#3.1 … the client is notified in just 3 ms about the response …
#3.2 It takes another 5 ms to get the response … and
#4 … another 16 ms (!) to finalize the query
Why is that (#3.2, #4), why do we lose around 20 ms?
Let’s drill down and open the trace for #3.2

Apparently the time was wasted for thread synchronization. Fine, then let’s analyze #5:

Another deferred call? This time we have lost 16 ms, so 21 ms in total because of deferred calls.
Performance summary:
Conclusion
SpeedTrace Pro is a powerful tool – much more than a simple profiler, it helps you to investigate complicated issues, find their root causes, and design the right solutions. This, of course, could not have been done without the sophisticated functionality it provides.
Due to its power and reliability, SpeedTrace Pro is no tool for just for one night. If you are interested in a long-term relationship being proactively responsible for your Continuous Application Performance Management, please feel free to just fall in love with it.


