Registry
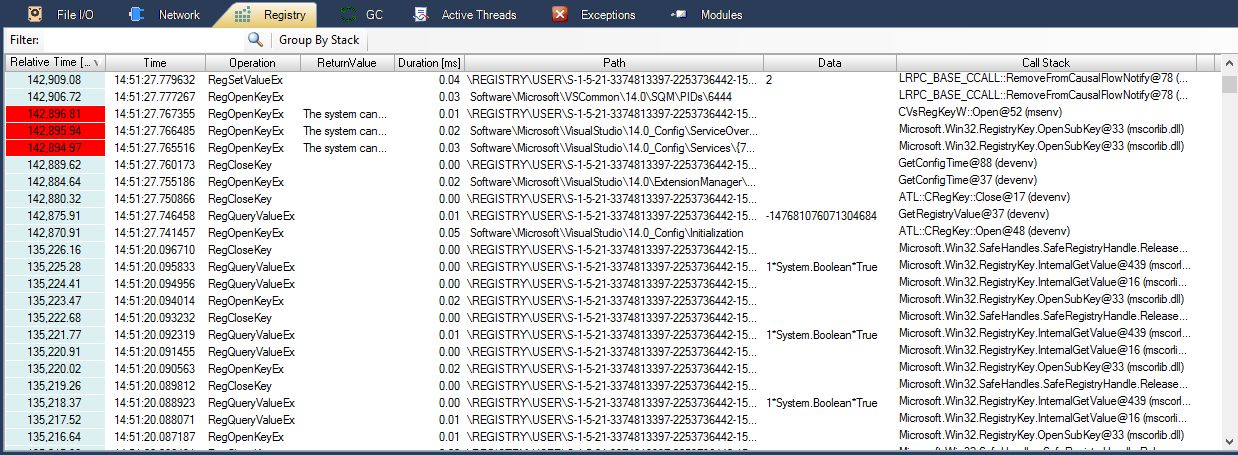
The registry view shows all registry activities that were captured from the target process.
Column Name |
Description |
Relative Time [ms] |
Time of the window operation event |
Operation |
Operation that was performed e.g. QueueWorkItem, CreateThread etc. |
Duration [ms] |
Time spent for the execution of the operation |
Count |
Number of objects of the specified type |
Call Stack |
Call stack which triggered the operation |
If Group By Stack is enabled, the focus is on profiling to find out from where and which registry access was triggered with aggregated frequency and duration information.

If stack grouping is not activated, individual registry events can be investigated with time stamp information data values returned, duration information, registry path information. If trigger call stacks are configured to be recorded (→ settings), the trigger call stacks will be presented as well.
