Profile/Trace an ASP .NET - IIS Web Site
To profile or trace an ASP .NET - IIS Web Site:
- Run .NET Runtime Analyzer. The Application Chooser window will open.
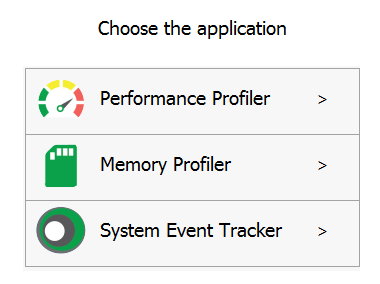
- In the Application Chooser window, specify the profiling type. You could choose between Performance Profiler, Memory Profiler and Systems Event Tracker.
For more details on profiling type, refer to the Profiling Methods section. - In the top panel Application To Analyze, select the tab Attach Running Process (CTRL + ALT + P):
- Select Target Process Name, a Process Browser window will be displayed.
- In the Process Browser window, select process name w3wp.exe.
Target Process : e.g. w3wp#11540
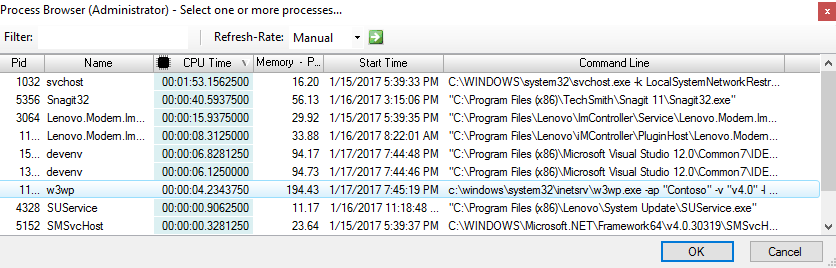
Please note that the name of the application pool Contoso can be used as filter to find the correct worker process, see below.

- Click Attach.
- Collect profiling data by clicking Get Results.
- Analyze the collected snapshots in the Performance Viewer or Memory Viewer or Systems Event Viewer (depends on the profiling type you select).