Profile/Trace Standalone Application
To profile or trace a standalone application:
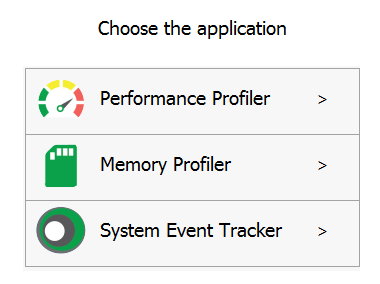
- Run .NET Runtime Analyzer. The Application Chooser window will open.

- In the Application Chooser window, specify the profiling type. You could choose between Performance Profiler , Memory Profiler or Systems Event Tracker.
For more details on profiling type, refer to the Profiling Methods section. - In the top panel Application To Analyze, select the tab Start Application:
- Specify the path to the application executable (to be started) in the Application field.
- Optionally, if your application requires command-line arguments on startup, specify Arguments in Start Arguments.
- Optionally, if you will like to change your application working directory, specify the directory in the Working Directory. Default: The path to the application executable folder.
- Optionally specify the target process(es) to record:
- If the target process is a child process of the started application, specify the Target Process Name(s) which should be recorded. For the target process specifications, wildcards can be used for example: MyAwesomeCompany.*
- Optionally, you can filter the right target process by the Target Process Arguments in case of the start of multiple process instances of the same name.
- Optionally, if you need to analyze multiple child processes, you can set the Number of Processes to be traced for example 20 to trace the next 20 processes matching the specified target process name and target process start arguments.
- Then, wait for the target process(es) to be started. For each matching target process(es), a new document will be displayed. In the following example, 3 instances of the process devenv.exe are being started.

- Click Start App.
- Before you execute the actual target scenario within your application, please perform the Clear operation to remove profiling/tracing history that was recorded before the target scenario is executed.
- Collect profiling/tracing data by clicking Get Results.
- Optionally, you can save the snapshot.
- Optionally, you can click Detach button to stop profiling/tracing.
- Analyze the collected snapshots in the Performance Viewer or Memory Viewer or Systems Event Viewer (depends on the profiling type you select).