Profile/Trace Running Process
To profile or trace a running process:
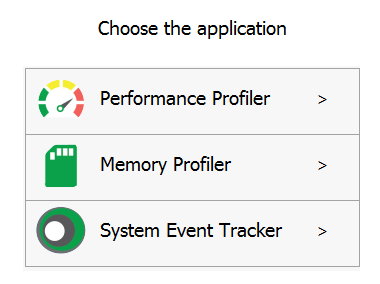
- Run .NET Runtime Analyzer. The Application Chooser window will open.

- In the Application Chooser window, specify the profiling type. You could choose between Performance Profiler , Memory Profiler and Systems Event Tracker.
For more details on profiling type, refer to the Profiling Methods section. - In the top panel Application To Analyze, select the tab Attach Running Process:
- In Target Process, select one of more .NET 4 or higher processes (with the help of the process browser) to attach.
- Click Attach button.
- Before you execute the actual target scenario within your application, please perform the Clear operation to remove profiling/tracing history that was recorded before the target scenario is executed.
- Collect profiling/tracing data by clicking Get Results.
- Optionally, you can save the snapshot.
- Optionally, you can click Detach button to stop profiling/tracing.
- Analyze the collected snapshots in the Performance Viewer or Memory Viewer or Systems Event Viewer (depends on the profiling type you select).