Network
The Network view shows all network API operations that were captured from the target process.
Tracing mode: Shows all operations with time stamps, operation type, length, duration, data that is sent or received, local and remote address.
If network API operation trigger stacks are configures (→ Settings) also line-level call stacks will be presented.

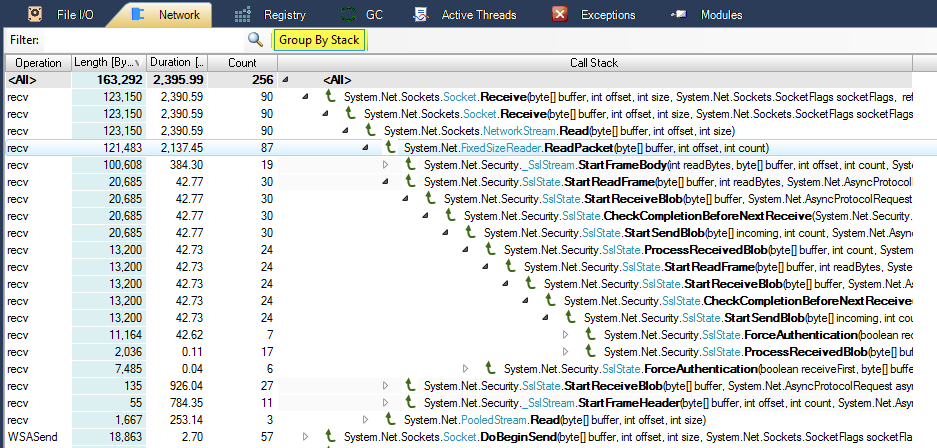
If group by stack is activated, the information is grouped by the merged trigger stacks.

In the profile mode specific information like time stamps or data is unavailable to focus on the aggregated information Length, Duration and Count. That way you can find out which call stack has contributed the most to socket operation (recv/send) length, time consumption or (recv/send) count.