Modules
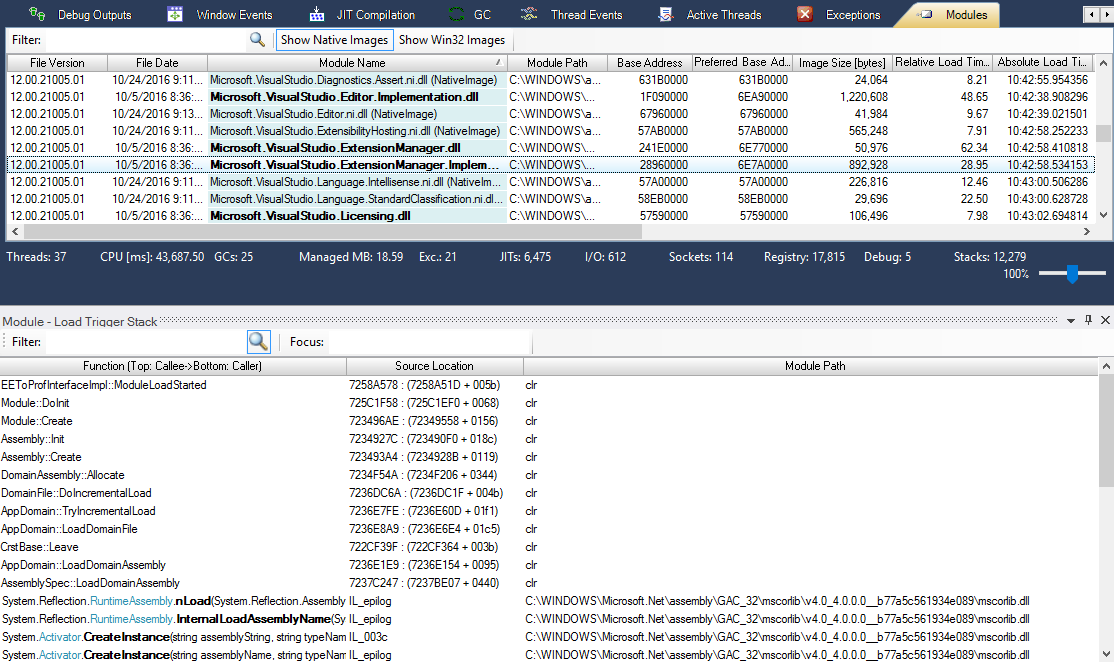
The modules view shows all modules that are currently loaded into the target process and includes the following information:
Column Name |
Description |
ASLR Flag |
Indicates whether ASLR (Address Space Layout Randomization) is turned on for the module |
Base Address |
Shows the actual address at which the module was loaded (see also Is Relocated) |
File Date |
Last modified date of the file |
File Version |
Version of the file |
Image Size [bytes] |
Total size of the mapped image (module) in bytes |
Is Relocated |
Indicates if the module was relocated, in other words if the module could not be loaded at the preferred base address. In case of native images relocated images additionally the modules will be highlighted with a yellow background colour. |
Load Order [ms] |
Indicates the order the module was loaded. The load order shows the relative time in milliseconds (compared to the first loaded module) at which the module was loaded |
Load Time[ms] |
Duration [ms] for loading the module |
Module Name |
Name of the module/assembly |
Module Path |
Complete path of the module |
NX-Flag |
Indicates whether the NX (No eXecute)-flag is turned on |
Preferred Base Address |
Shows the preferred address at which the module was loaded (see also Is Relocated) |
Private Memory |
Shows the private memory that is used by the target process. The private memory cannot be shared between processes and is caused by either image relocations (rebasing) or private data sections of the module. This information is only captured when using the Memory (allocation) mode. |
Relocation Reason |
Shows the identified causes in case of relocations why the modules could not be loaded at the Preferred Base Address |
Note:
1. MSIL assemblies are presented with bold font in the module name column.
2. Native images are presented with (NativeImage)-suffix.
3. Win32 assemblies are presented with (win32)-suffix.
4. Relocation events which cause performance hits and also increased private memory usage for the application startup are presented by yellow-highlighted lines.
Additionally, for each relocation, the relocation reason (modules that are loaded earlier at the same address range) is pinpointed.

Each module entry provides the following context menu:
Action |
Description |
Install Native Assembly (Production) |
Installs a native image for the production environment |
Uninstall Native Image (Production) |
Removes the native image from the production environment |
View Load Trigger Stack (F10) |
Shows the call stack which triggered the load of the modules |
Select All (CTRL + A) |
Selects the whole table |
Copy Info (CTRL + C) |
Copies the selected information as presented |
Search (CTRL + F) |
Full text search |
Search Next (F3) |
Search next hit |
Search Previous |
Search previous hit |
Native Images for Optimization Testing (requires administrator rights)
In order to test how the generation of native images will improve the start-up performance of the executed scenario, the .NET Runtime Analyzer tool provides operations to generate/remove native images for/from the production/testing environment.
The related operations are available in the context menu of the JIT-Compilation and Modules-Tab.
Action |
Description |
Install Native Assembly (Production) |
Installs a native image for the production environment |
Uninstall Native Image (Production) |
Removes the native image from the production environment |
Note: For production environment optimization tests, the JIT-compilation tab should be used to generate images for modules where JIT compilations occurred.