Managed Objects
The Managed Objects view shows performance statistics about all managed objects which are present at the time of the snapshot.
The Managed Objects panel consists of two panes:
- Heap Statistic Overview.
- Details View:
- Contributors view (left panel) and
- information of Live Objects (right panel):
- Shortest Root Path (why is alive?)
- Allocation Stacks (what is alive?)
The graphic below illustrates on how to read the memory profiling data.
Recorded time range: 20:51 - 20:54
Selected time range: 20:51 - 20:54 (no time range filter)
Selected time to investigate: System.String
From the managed heap stats (for System.String), we can see the following information:
Live instances at snapshot time: 660.973
Total memory usage: 109.023.914 bytes (for 660.973 instances)
Largest object: 88.196 bytes
Smallest object: 14 bytes
Number of large objects (>85.000 bytes): 1
Total Large Object Heap (LOH) size: 88.196 bytes

Operation |
Description |
Type |
Type of the object(s) |
The type “Free” shows memory that is not yet compacted. A high value (Size, Count) could be an indication for issues with LOH or pinned objects. |
|
Count Share |
Percentage: (count of objects with the specified type)/ total object count |
Size Share |
Percentage: (size of objects with the specified type)/ total size |
Count |
Number of objects of the specified type. |
Size |
Number of bytes consumed for the specified type |
Max Size |
Largest object with the specified type |
Min Size |
Smallest object with the specified type |
LOH Size (bytes) |
Total size of large objects with the specified type |
# of large objects |
Total number of large objects with the specified type |
Details View
The lower pane Details pinpoints why type instances of the selected type are still alive and shows the object creation stacks of these alive objects.
The detail view in section displays all object instances of the selected type with its addresses and size. When the selection in the profiler section is changed by switching to another type, the detail section is updated to display all objects with size and address information.

Contributors
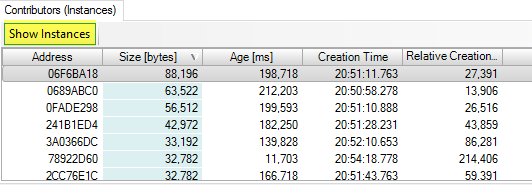
Its left panel Contributors shows the list of contributors which sum up to the total instance count and size for the selected type.
The view can be switched to include object instances, so that every single object is displayed including the following info:

- Object instance address at snapshot time
- Object instance size
- Object age at snapshot time
- Object creation date
- Relative Object Creation Time, relative to the attach time
When Show Instances is unchecked, aggregated information, group by shortest root path, is displayed.
For each root path, the following info is displayed:
Column Name |
Description |
Count |
Number of object instances |
Size |
Number of bytes |
GC Roots |
Type of the root with detail information |
Min/Max/AVG Age[ms] |
Minimum age, maximum and average object age at snapshot time |
Min/Max/AVG Relative Creation Time [ms] |
Minimum age, maximum and average relative creation time, relative distance to the attach time in milliseconds |
Min/Max/AVG Creation Time |
Minimum age, maximum and average absolute creation time with time stamps |
In the Contributors view you can select one ore more root paths.
The corresponding merged Shortest Root Paths and Allocation Stacks are displayed on the right side of the Details panel.
Shortest Root Path(s)
The shortest root path(s) shows why an object instance/multiple object instances has/have not been garbage collected.
A root path is the path of referrers from the selected instance to a root which keeps the object alive.
Roots Types
Roots can be of the following type which describe the kind of reference being held:
Column Name |
Description |
StaticVar |
A static variable in a type, Format: static var <Type>.<Field>, example: static var System.Net.ServicePointManager.s_ServicePointIdlingQueue. Roots are alive as long as the app domain lives. |
LocalVar |
Local variable or parameter of a method. Roots are alive during method execution |
Finalizer |
Object scheduled for finalization. Roots alive until the finalizer is run. |
Handle |
Accessing a managed object from unmanaged code. Roots must be alive as long as managed objects can be accessed from unmanaged code. • Weak Short Lived • Weak Long Lived • Strong • Pinned - Strong handle, prevents relocation of target object. • RefCount - RefCounted handle (strong when the reference count is greater than 0). • Dependent - A weak handle which may keep its "secondary" object alive if the "target" object is also alive. • AsyncPinned - A strong, pinned handle (keeps the target object from being relocated), used for async IO operations. • SizedRef - Strong handle used internally for book keeping. |
ThreadStaticVar |
Thread static var <Type>.<Field>. Roots are alive as long as the application domain lives. |
Allocation Stacks
The Allocation Stacks shows the call stack(s) which triggered the object creation of the selected object instance(s).
