Hotspots
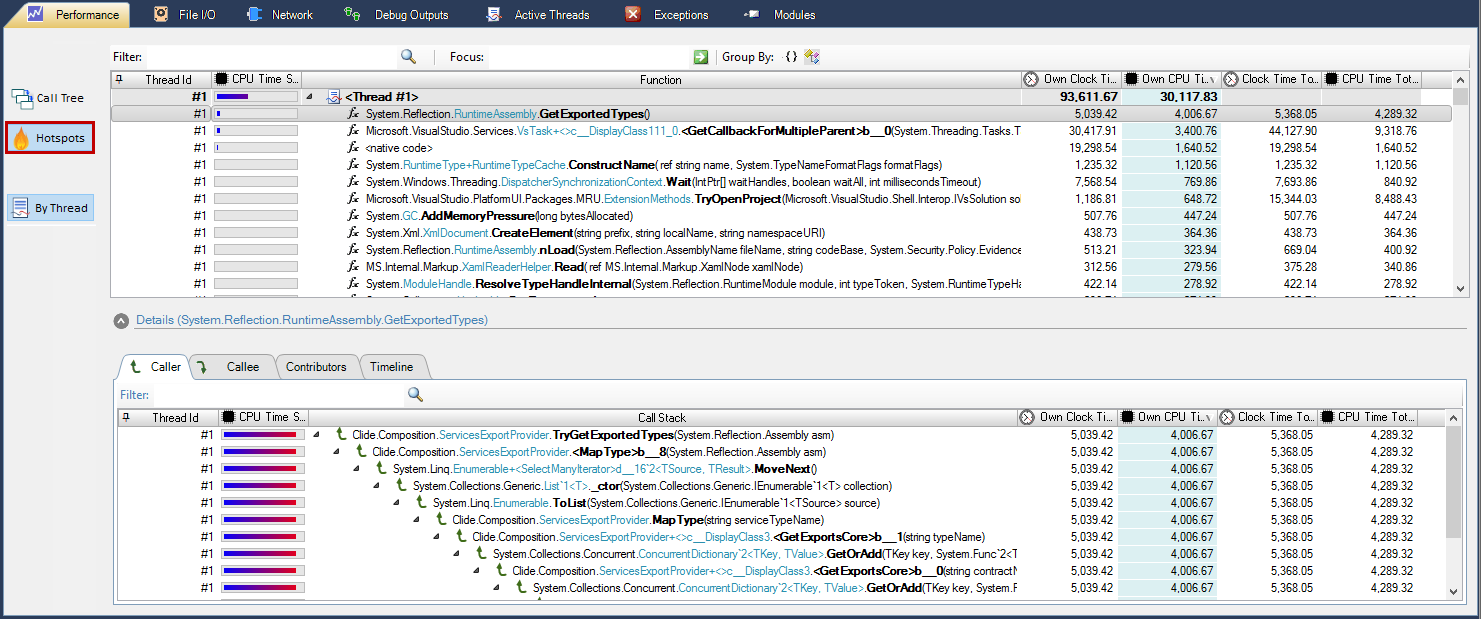
The Hotspots view lists functions with highest execution time in the profiled application.

The performance data hotspot view provide the following information:
Column Name |
Description |
Clock Time Total [ms] |
Total time elapsed for the method including call methods (children) : |
Clock Time = CPU Time + Waiting Time (File I/O, RPC-Calls etc.) |
|
Own Clock Time [ms] |
Time elapsed for the method itself excluding all called methods. |
CPU Time Total [ms] |
Amount of time for which a central processing unit (CPU) was used for processing instructions while executing the method including all children. |
Own CPU Time [ms] |
CPU Time for the method itself excluding called methods (children). |
Clock Time Share |
Percentage: (Clock Time for the method, call stack) /Total Thread Clock Time |
CPU Time Share |
Percentage: (CPU Time for the method, call stack) /Total Thread CPU Time |
Call Stack |
Back traces to show where the load (CPU time, clock time) was triggered from. On top of the stack is the time that was spent for the hotspot. The nodes below show the responsible callers triggering the load. |
The view provides the following operations:
Action |
Description |
By Thread |
If thread grouping is active, for each thread hotspots will be listed individually. By default, group by thread is unchecked and all threads are merged. |
Filter |
Shows all hotspots related to a specific topic as load triggers for CPU or clock time. As filter you can use method names that need to appear in call stacks or namespaces that should be included like System.Reflection.* or unmanaged DLL names like clrjit.dll to find the load triggers for JIT compilations. |
Group By Namespace |
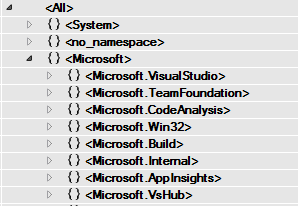
Via toolbar : Groups all calls made within a certain namespace or assembly.
|
Group By Class Name |
Via toolbar: Groups all calls made within a certain class name.
|
Details View
Caller
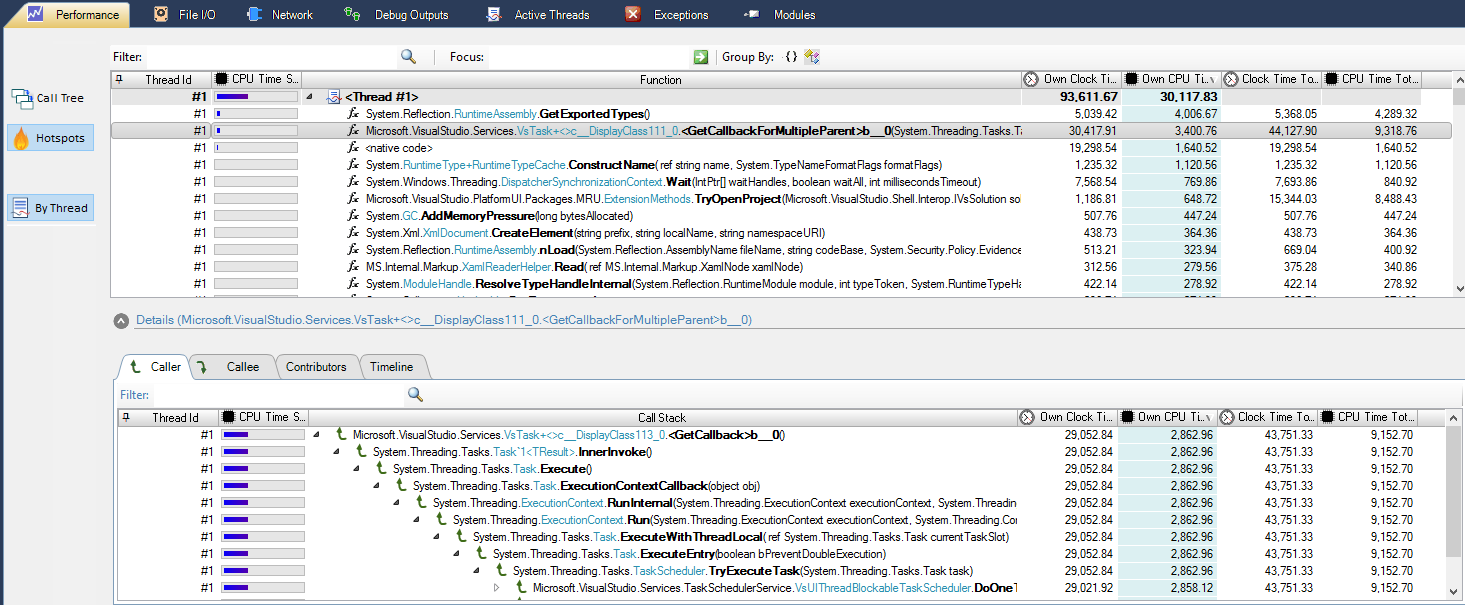
Caller view shows all stacks (as back traces) that triggered the invocation (called) of the selected function. In addition to the (trigger) Call Stack, the triggered clock time and CPU time is displayed for each node (stack frame) in the (back trace) Call Stack tree.
In the example shown, the lion part with 29 seconds (of 30,4 s) clock own time is triggered by the anonymous method within VsTasks.GetCallback().
Of the 3.4 seconds CPU own time usage, 2.86 s is triggered from the same.
The remaining clock own time (1.4 s) is triggered by the anonymous method within VsTasks.GetCallbackForSingleParent().
The remaining CPU own time is triggered from the same method.
For more details just expand the nodes in the Call Stack to get the parents of the trigger methods.

Callee
Callee view shows the tree of called methods or functions which are activated from the selected function. For each node in the call tree, clock time and CPU time is displayed.

Contributors
Contributors view shows all methods / functions that are called during the execution of the selected function in the Call Tree.

Timeline
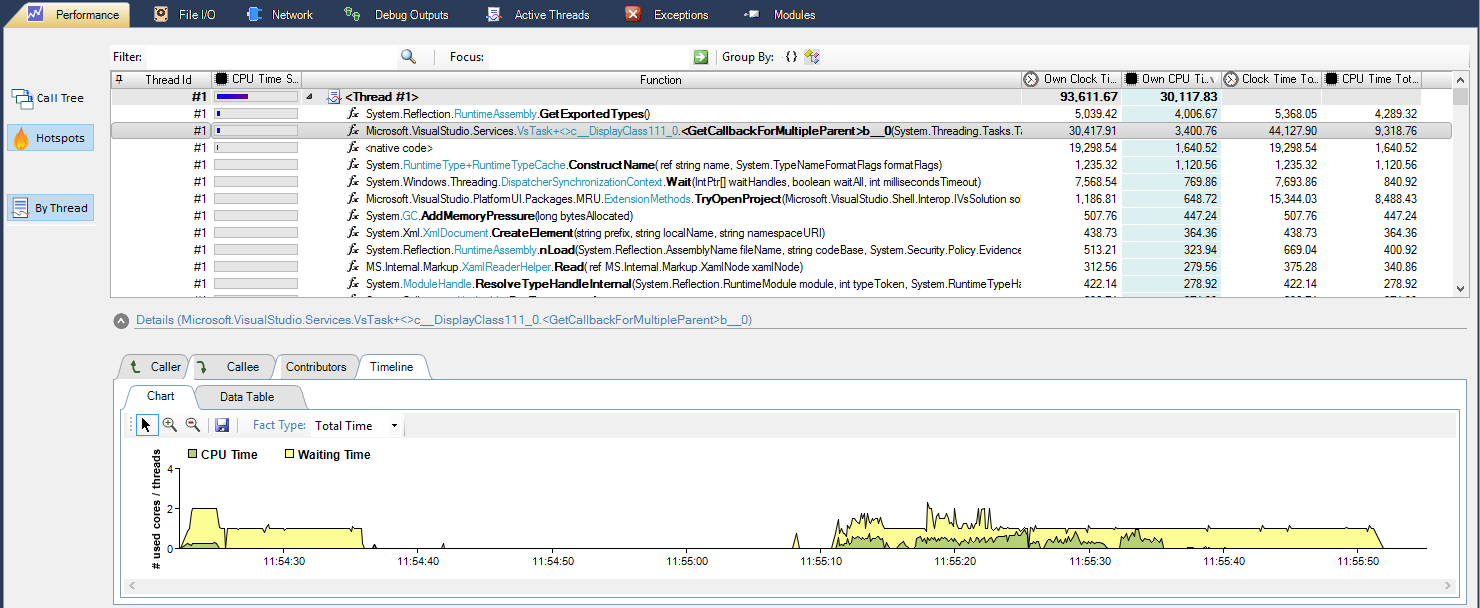
Timeline view shows method execution activity over time.
Select the fact type
- Total Time to show the timely execution, in other words when the method was executed.
In case of using Total Time all methods (children) which contribute to the execution time are included. - Own Time to focus on the method itself (exclusive self time).
In either case CPU Time depicts the time loss due to CPU related method activity whereas Waiting Time relates to non-CPU usage related time losses due to waiting such waiting for resources (File I/O, Network I/O, RPCs) etc.


