Exceptions
The Exception view displays all exceptions that have occurred after process attachment and includes the following information:
Column Name |
Description |
Relative Time |
Time [milliseconds since start], when the exception was raised. |
Exception Type |
State the type of the exception. |
Message |
Specify the exception text. |
Call Stack |
Trigger line-level call stack of the exception. |

In order to clear the exception history to focus on new exceptions, you can carry out the clear-function , which clears all recorded data.
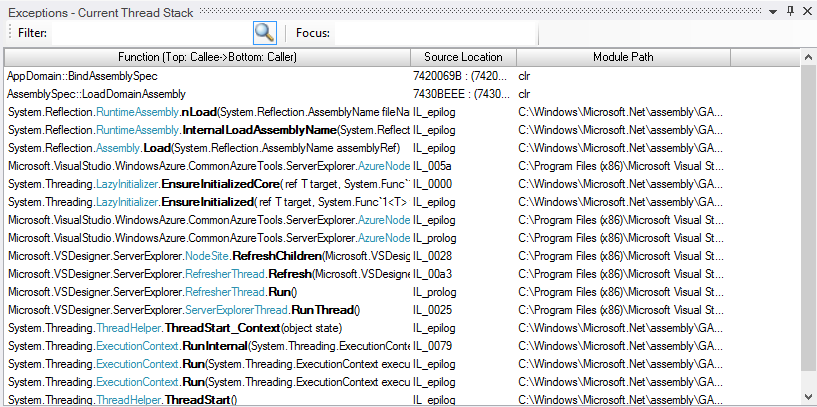
In order to view the line level exception trigger stacks for selected exceptions including the corresponding source code, you can use the use the Exceptions - Current Thread Stack.

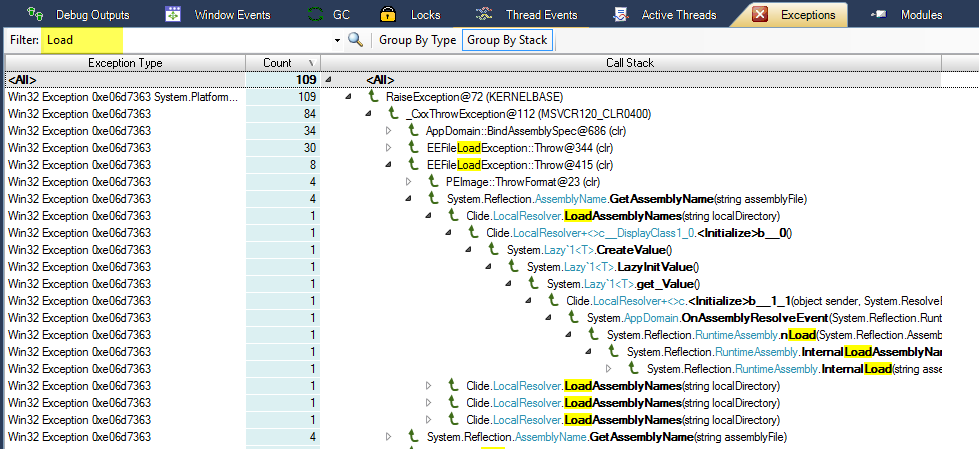
For efficient exception analysis, you can either instant filter/search the exceptions to focus on a limited set of interesting exceptions or perform exception grouping with stack merge to get profiling information in terms of caller/callee trigger stack back traces. In the example below stack grouping is activated, the sort criteria is sort by count descending whereas the instant search is activated to highlight all load occurrences.
Exception instance information like timestamps and exception messages is not available in this profile mode with aggregated data.
