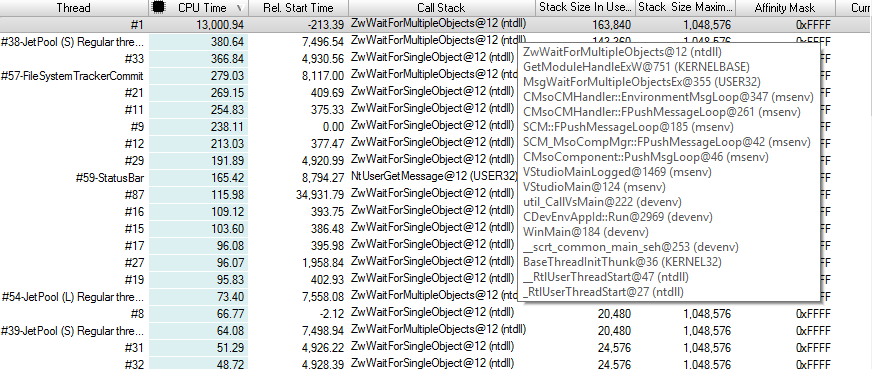
Active Threads
The Active Threads view shows all active threads at the time of the snapshot and displays the following information:
Column Name |
Description |
# of Owned Critical Sections |
# of critical sections owned by the thread |
Affinity Mask |
The mask indicates on which CPU the thread can run, e.g. the hex value f means the execution is enabled for the CPUs with numbers 0,1,2,3. |
Call Stack |
Currently executed method (top of the stack) with its callers (bottom of the stack) as line-level call stack |
Current Locale |
Current culture ID set for the thread |
CPU Time |
Amount of time for which a central processing unit (CPU) was used for processing instructions for the particular thread, also called thread time. |
Exception Code |
Exception code for the thread |
Exit Status |
Exit Status of the thread, 0x103 indicates the thread is alive |
Is Impersonating |
Indicates whether or not impersonation is active |
Last Error |
Last error occurred |
Last Status |
Last status |
Lock Count |
# of locks taken by the thread |
Relative Start Time |
Relative start time for the active thread (relative to the attach time). This information is not available, if the target process is attached after the creation of the thread. |
Stack Base Address |
The start of memory region for the current thread stack |
Stack Size In Use |
Size which is already used. If the Stack Size Maximum is reached, the application will crash due to an stack overflow exception |
Stack Size Maximum |
Maximum amount of bytes that can be used for the current thread as stack. The amount already used (committed) by the thread is indicated by Stack Size In Use, the remainder is reserved memory. |
Thread ID – Name |
Thread ID and name |
Priority |
Thread priority |

In order to view the call stacks, you can use:
- Active Threads - Current Thread Stack

- Mouse over the item in the Call Stack column
