The following post depicts how to concurrently trace multiple Azure servers with SpeedTrace Pro remote profiling capabilities. Following configuration steps are required to perform remote profiling Web apps or services from a client outside the Azure cloud:
Port Forwarding for the Cloud Application/Service
Add an InstanceInput endpoint in the role’s configuration:
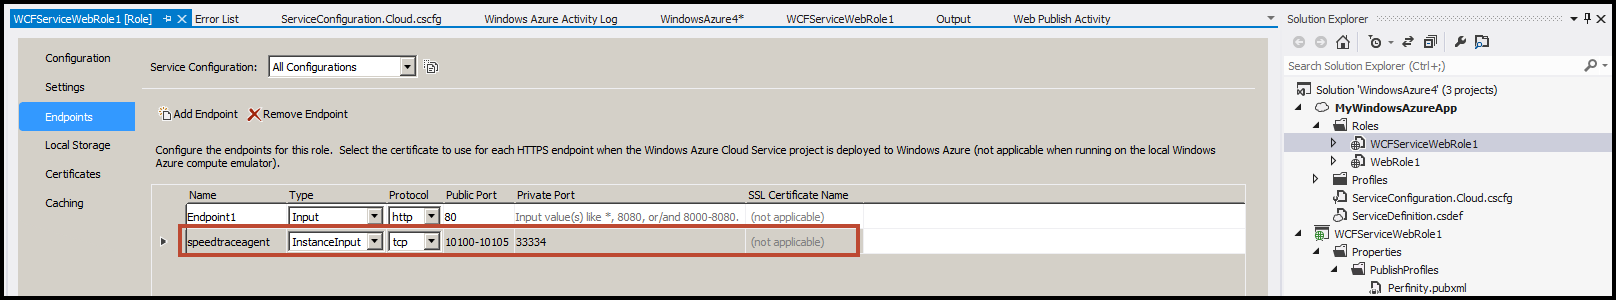
In this example above, we forward the public ports 10100-10105 to the private port 33334 on the server (SpeedTrace Agent default port), so that we can communicate with the agents on all six Azure machines.
Management Portal Configuration – Connect to the role instances
Since we need to connect to the role instances to deploy the trace agents, we need to enable remote desktop sessions. If not yet configured, we need to add a remote desktop endpoint.
Select the role instance of interest and press the connect button in the bottom center of the page which will download the rdp file. Double click the rdp file to connect to the target machine.

Configure the windows firewall – Inbound & Outbound rules
In the Windows Firewall with Advanced Security window, select Inbound Rules to create new rule.Under Rule Type, Select the option Port. Then, click Next.
Under Protocol and Ports, select option TCP and select Specific local ports. Enter 33334. Port  33334 is the default port for SpeedTrace Agent.
Install .NET Framework 3.5 or 2.0
Ensure that either .NET Framework 3.5 or 2.0 is installed in the machine.
In the server manager, for example: Windows Server 2012, Dashboard -> Add Roles and Features -> Features -> .NET Framework 3.5 Features.
Install SpeedTrace Agent, perform iisreset
Install SpeedTrace Agent only on the machine.
Simply deploy the setup file via remote desktop session copy & deploy.
After the agent installation perform iisreset (and restart w3svc if stopped) to update the profiling environment.
Download & Install dropbox on the server
Install dropbox or similar software to store share the trace results in the cloud.
Share the output folder and configure permissions
Controller Machine (SpeedTrace Client Dashboard)
1)Â Â Â Â Â Download the latest version of SpeedTrace Pro full installation
2)Â Â Â Â Â Install Dropbox or something similar in order to read the trace output files from the cloud
3)Â Â Â Â Â Share the Dropbox Public Folder as a network share called “outputs”.
4)Â Â Â Â Â Create a trace project for each target computer that you want to trace. You can use the clone functionality to minimize the configuration effort.
5) Â Â Â Configure the target computer as follows:
Hostname: <Azure Server>: <Port>
e.g. perfinity-speedtracecloudapp.net:10100
Please use the port numbers which have been configured as public ports (Port forwarding).
To configure the storage output, select Advanced Tab and check the Output Storage Directory. In this example, we have configure the path as following  \\localhost\outputs
Final result
We can simulataneously trace and profile multiple applications & services on different Azure servers.
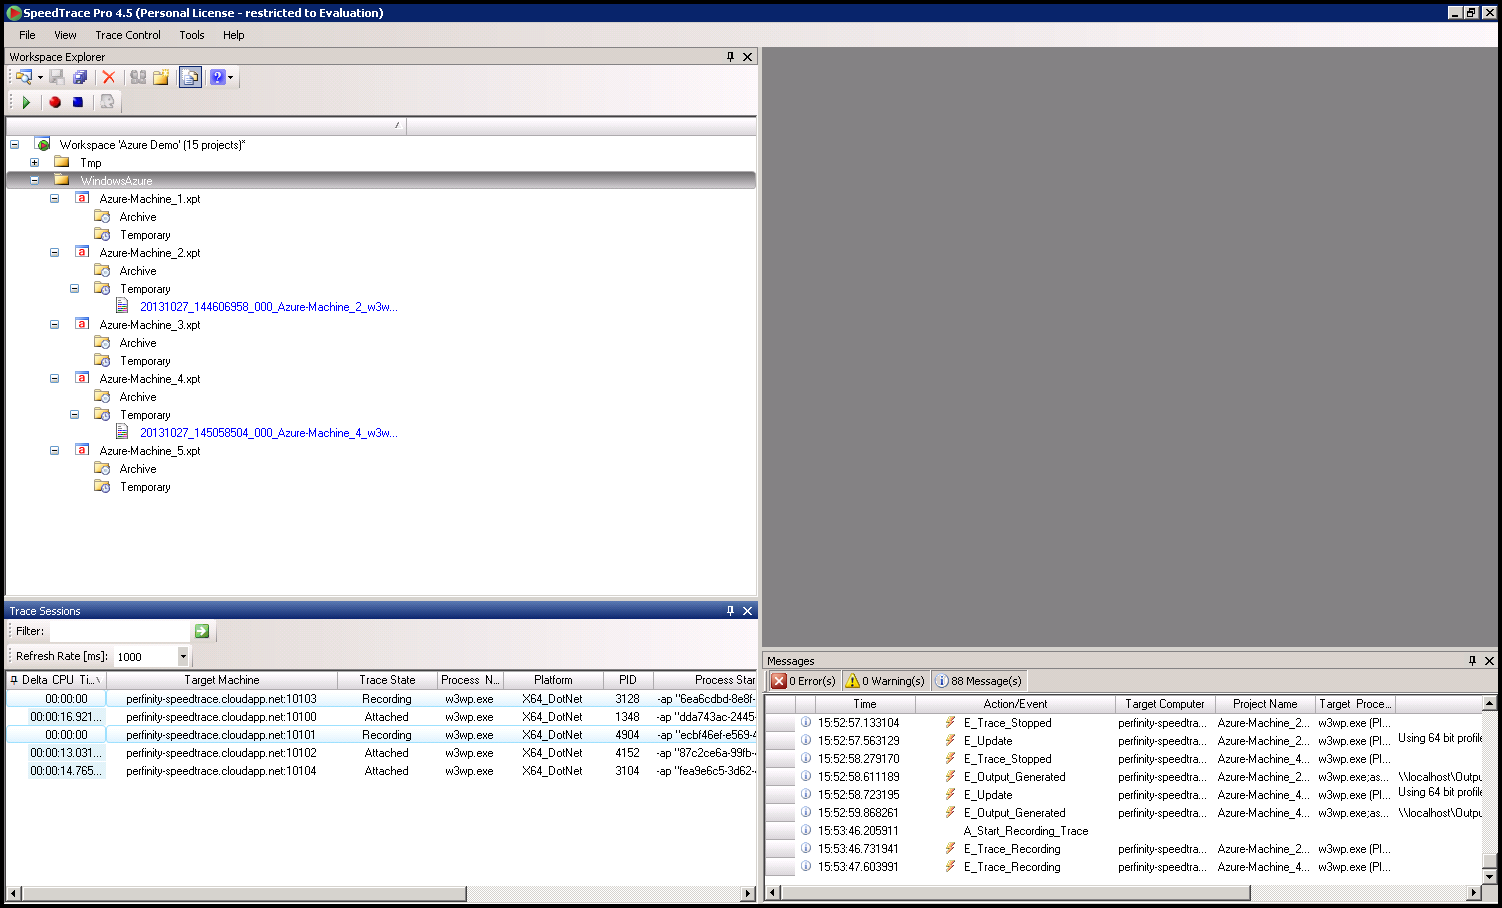
In the example above the controller is attached to 5 Azure machines, whereas 2 machines are currently recorded.
Â
For a more detailed documention please contact our support team.
1 comment
Leave a comment

Works fantastic. Thanks for that.